Introduction
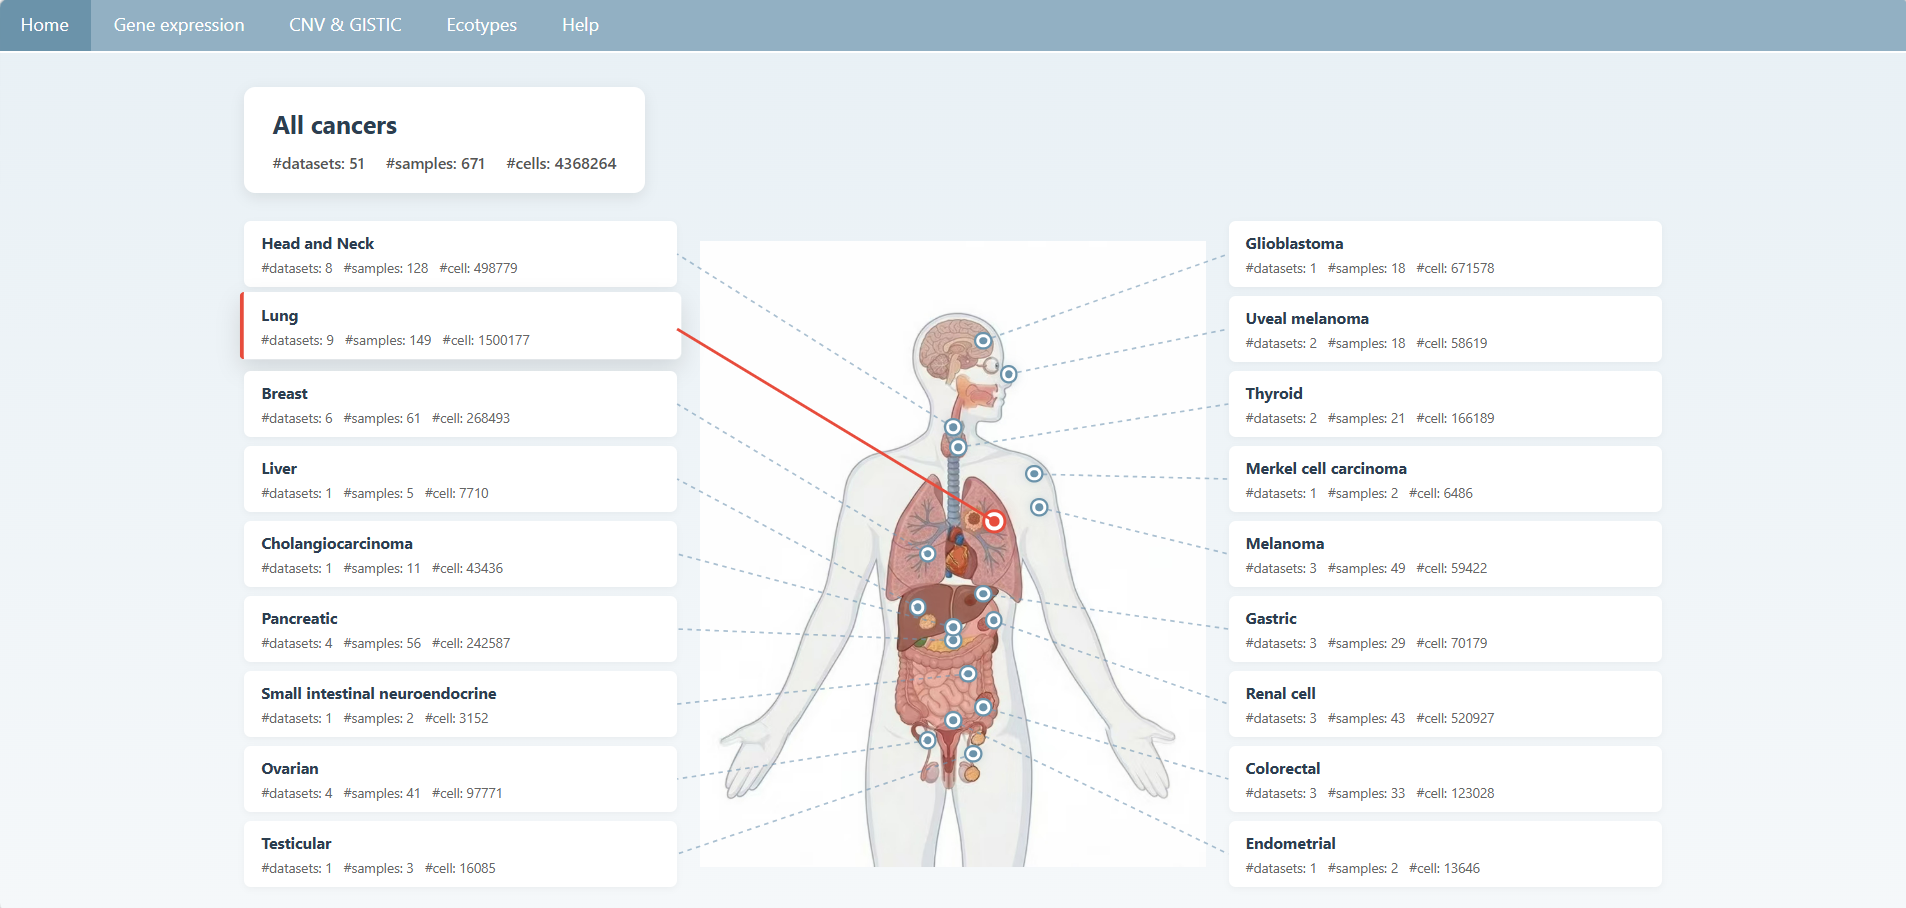
This database website containing a pan-cancer single-cell atlas comprising 369 primary and 302 metastatic tumors across 18 cancer types and diverse metastatic anatomical sites.
Usage
Browse PanMetAtlas By Pages
If a certain type of cancer is of interest to the user, the user can click on the relevant cards on either side of the homepage to navigate to the page where the related data is displayed.
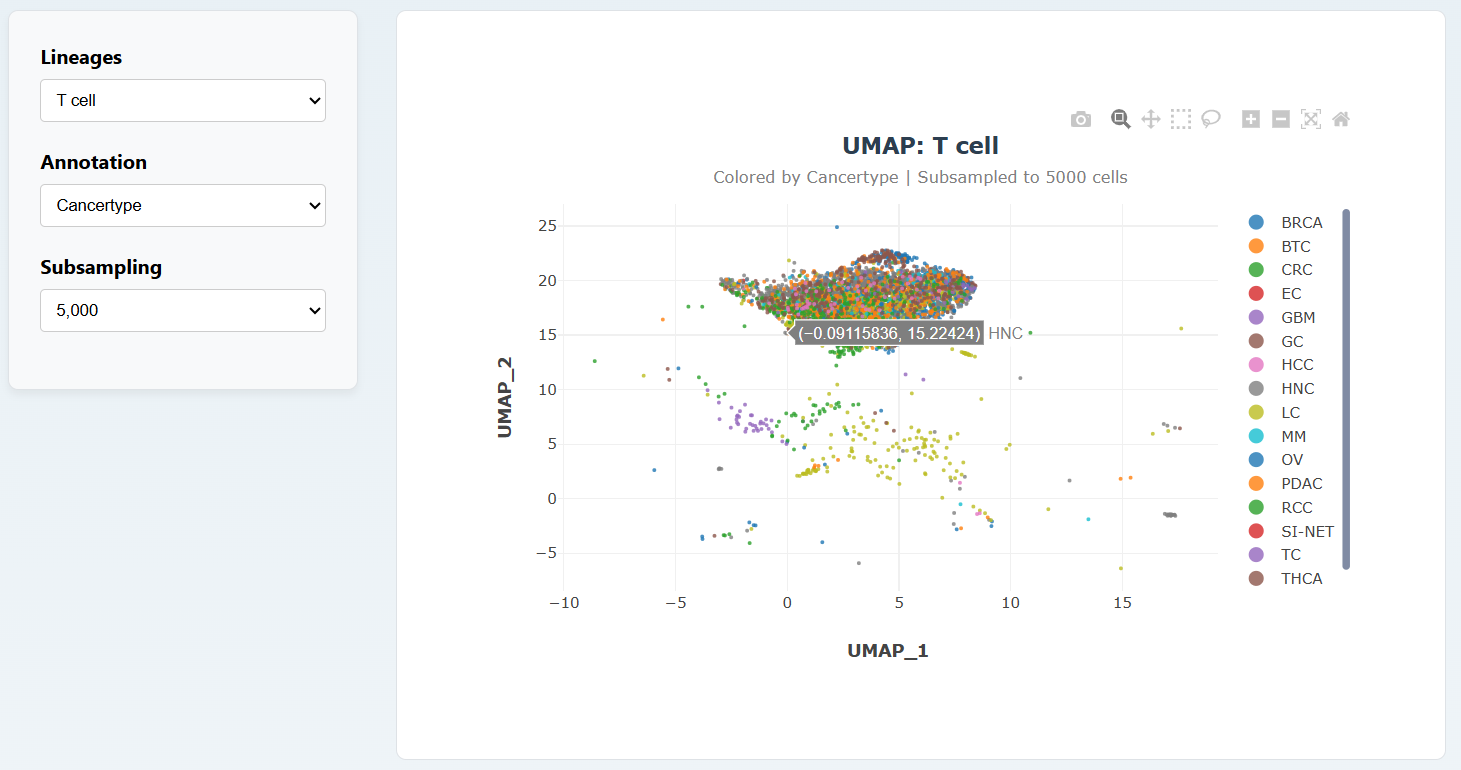
On the Gene Expression page, users can select different Lineages and different annotation methods to view different UMAP diagrams.
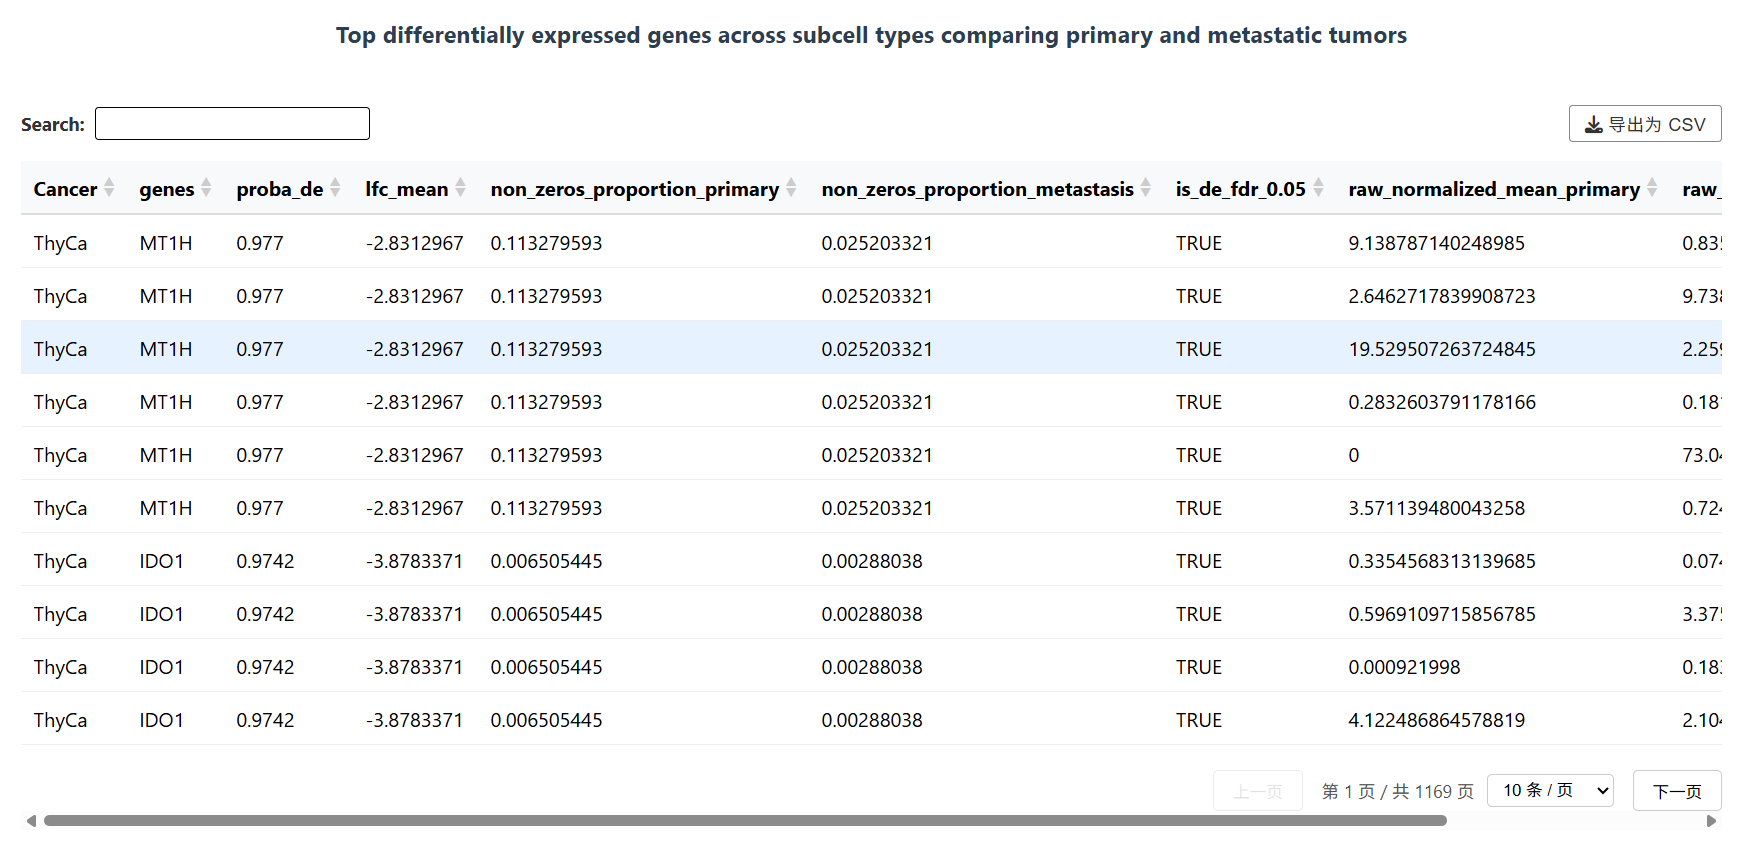
Top differentially expressed genes across subcell types comparing primary and metastatic tumors will displayed below the UMAP diagram.
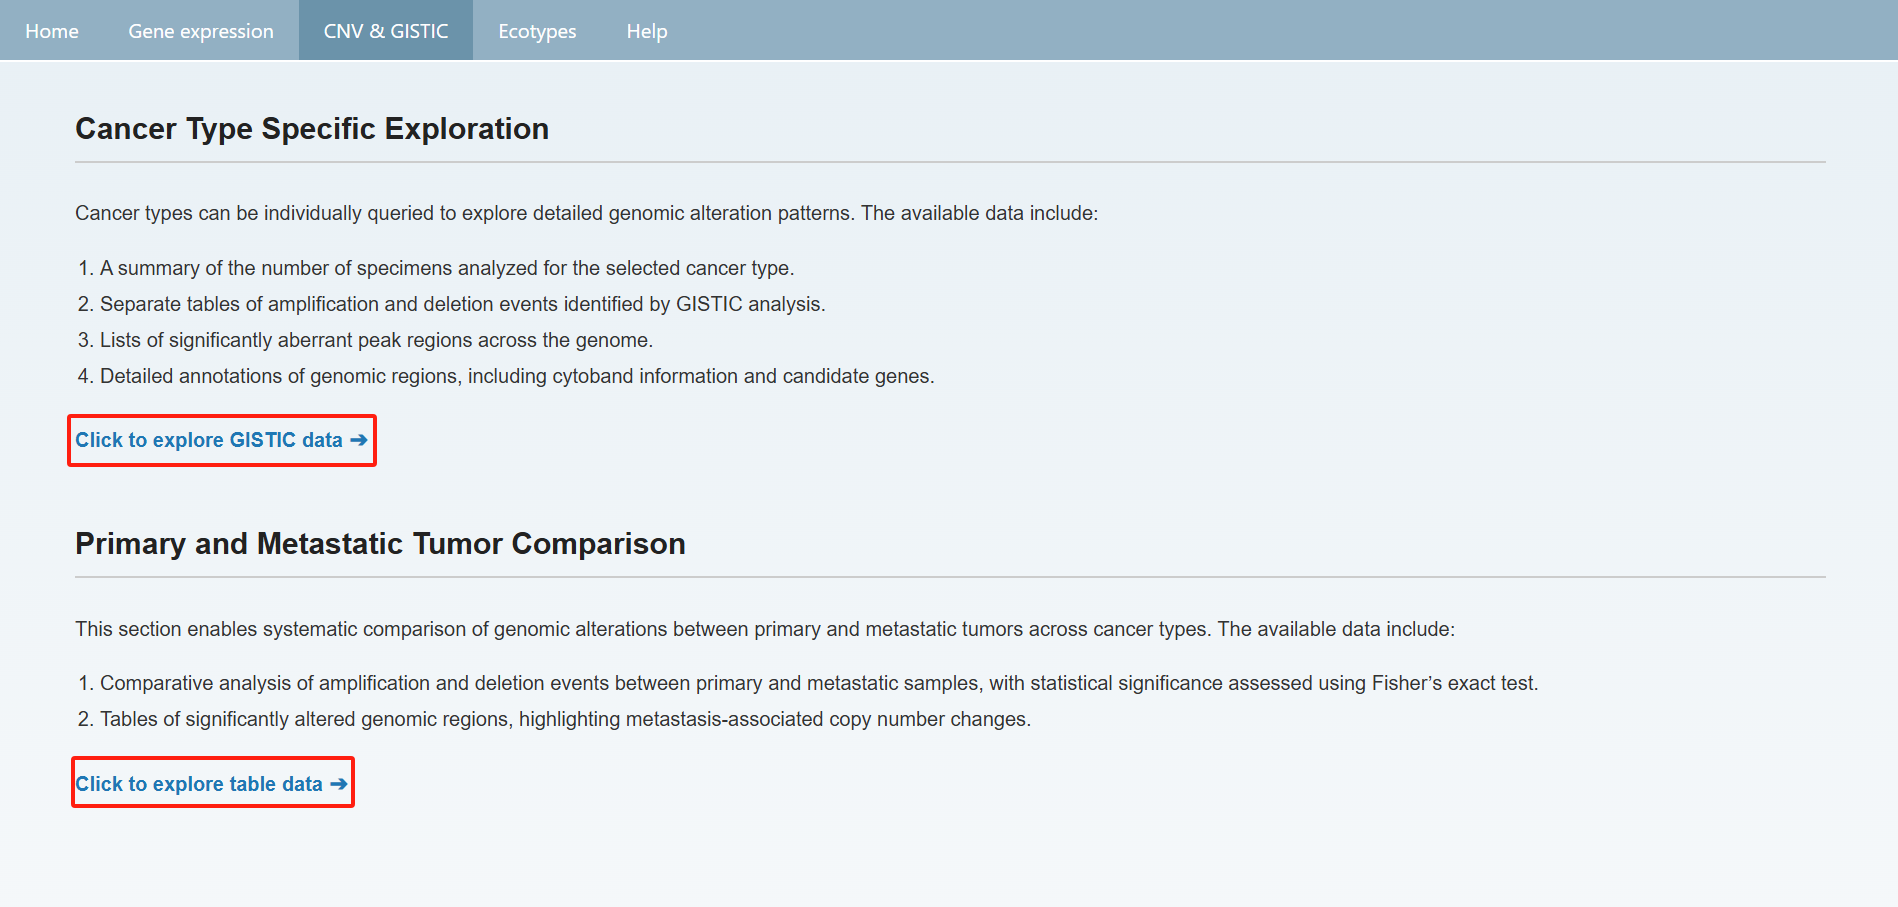
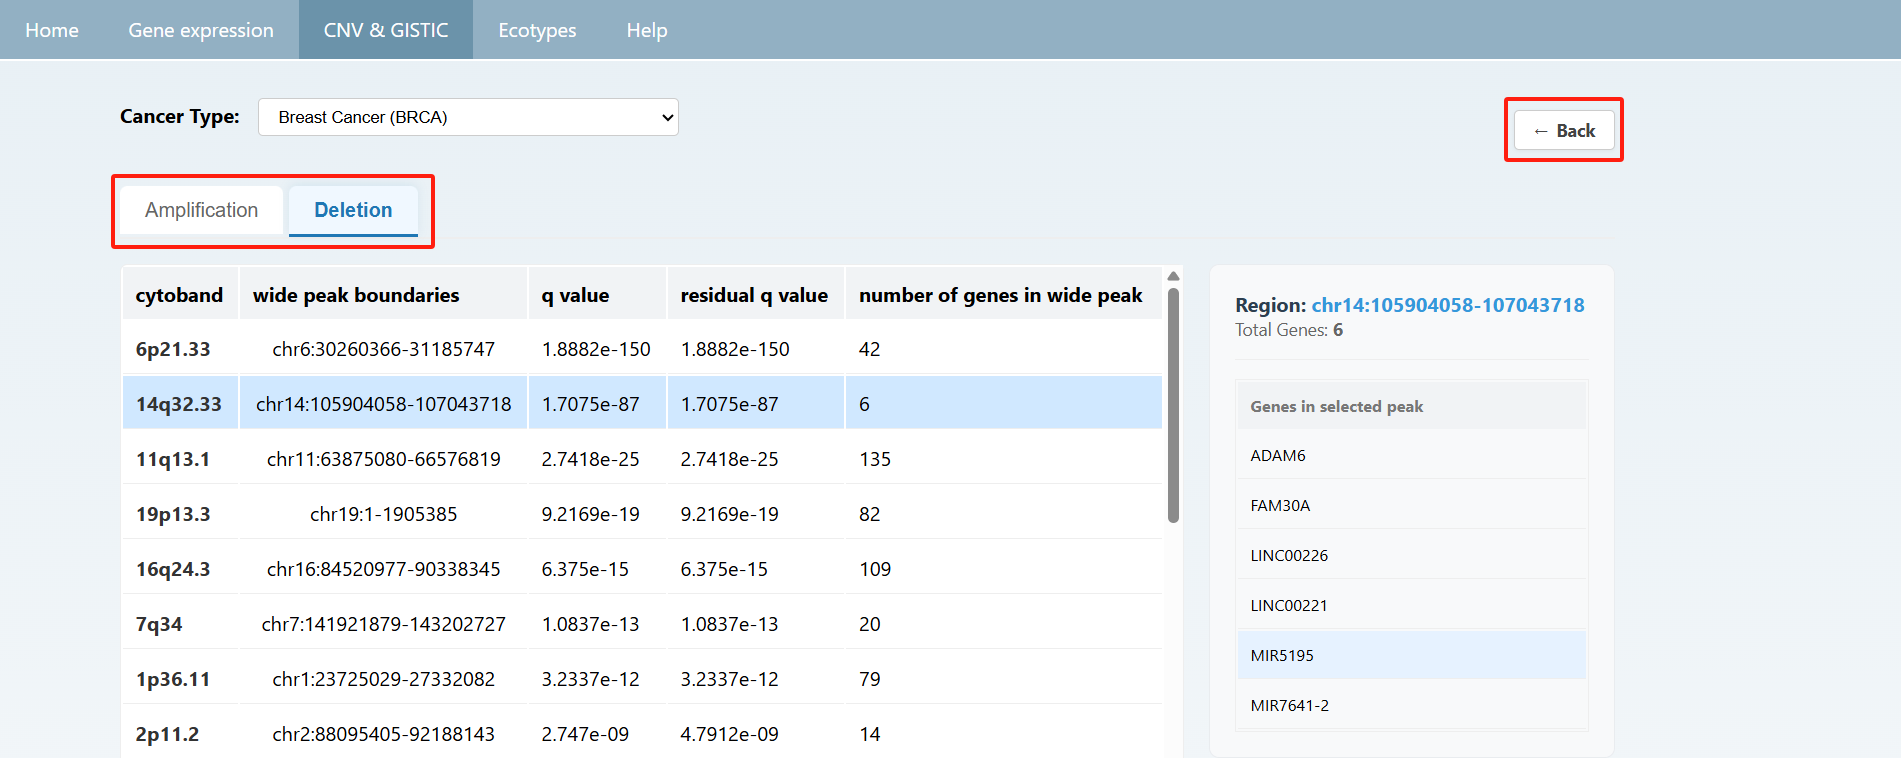
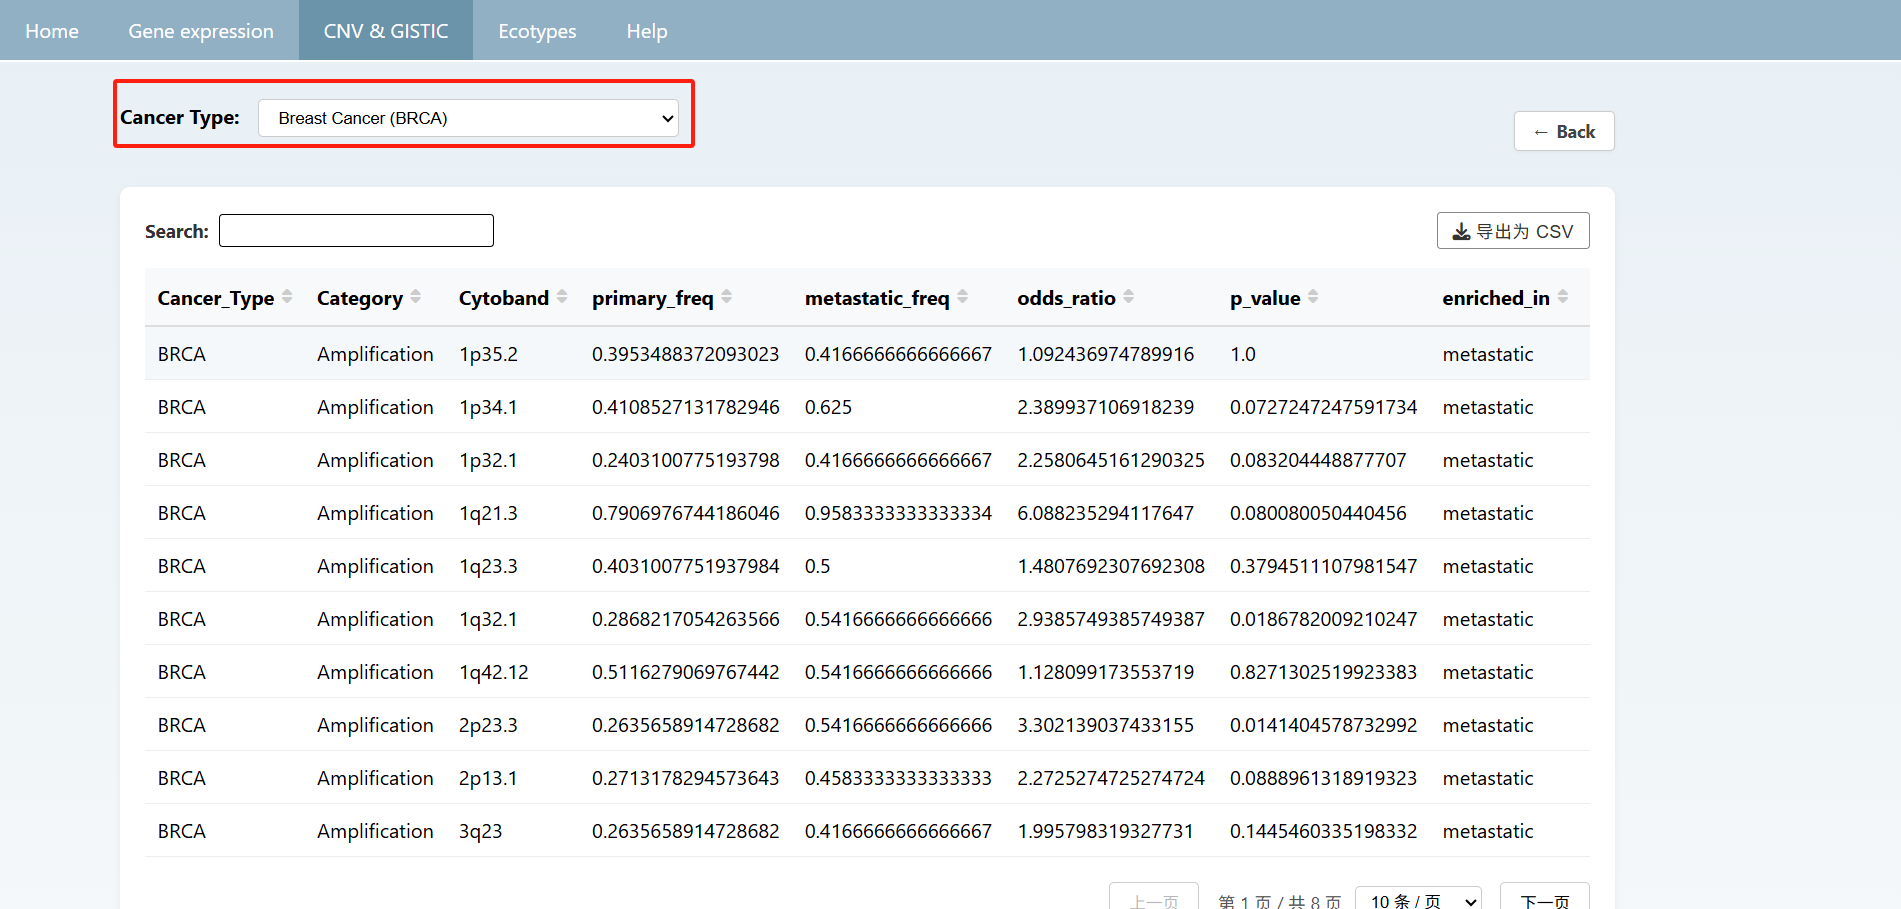
Users can also view the overall summary of information on the CNV & GISTIC page and click on the text below to view detailed data. On the detailed information page, you can select the desired cancer type from the "Cancer Type" section at the top to view the information. Afterward, you can click "back" to return to the previous page or directly click the navigation bar to jump to the corresponding page.
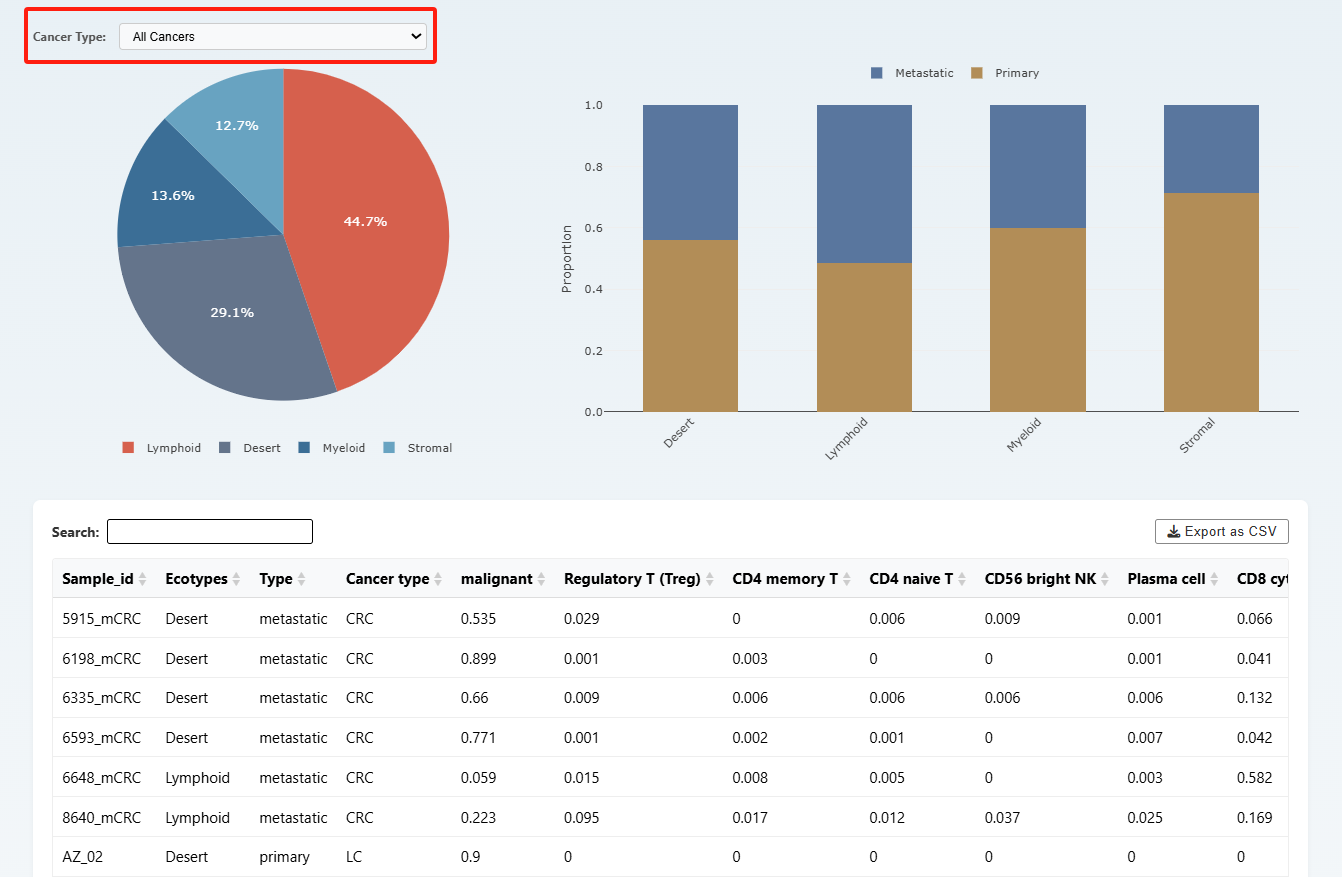
On the ecotype page, users can select different types of cancers at the top to view the distribution of sample Ecotypes as well as the proportions of primary and metastatic samples within each Ecotype. And the detailed Ecotype data are shown below.
Methods
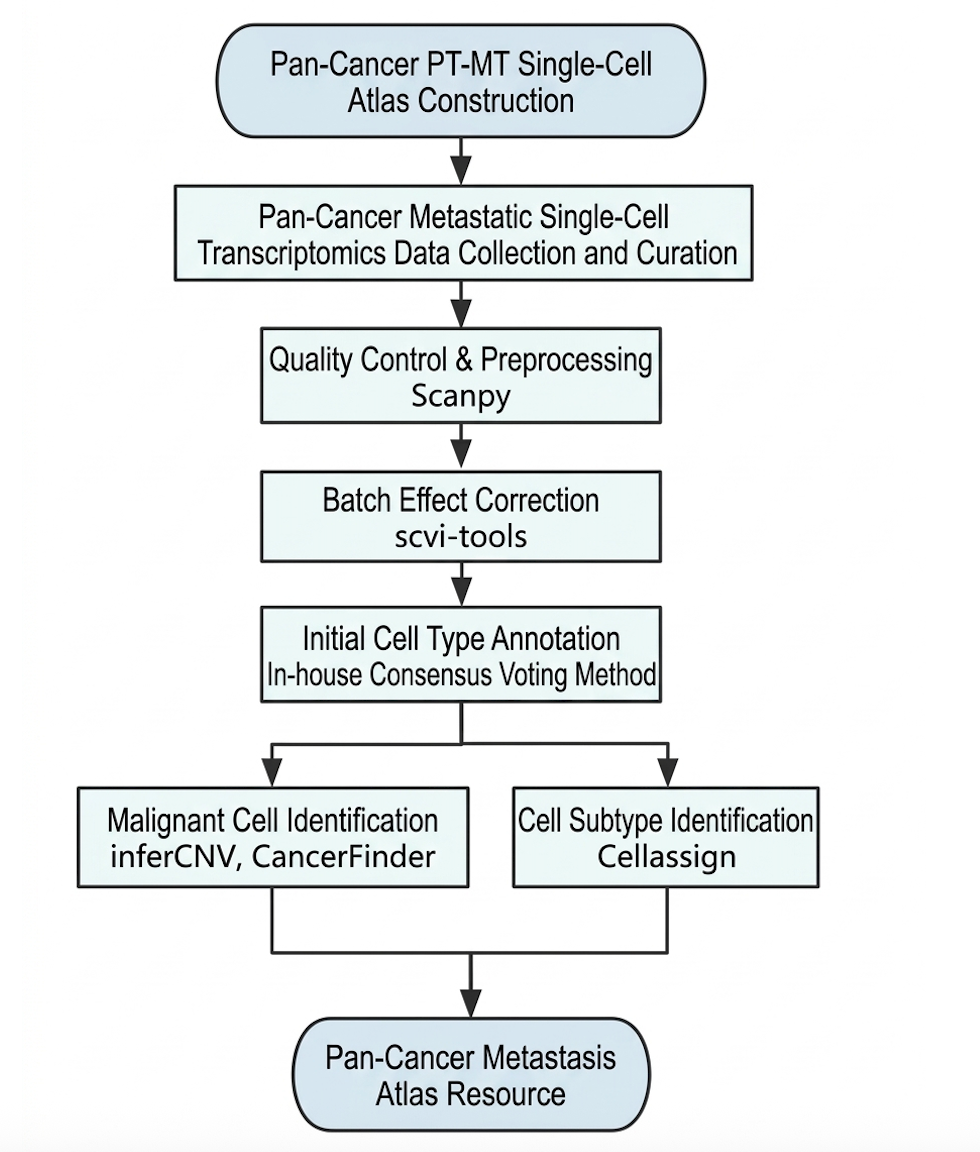
Single cell RNA-seq data collection
Publicly available single-cell RNA-seq datasets relevant to tumor metastasis were systematically collected. Datasets were identified through keyword-based searches using terms such as “scRNA” and “metastasis”, and were further curated manually by reviewing relevant publications to ensure inclusion of high-quality and biologically relevant data. Data inclusion and exclusion criteria were applied at both the dataset and sample levels. Specifically, datasets derived from sorted samples or fluid samples (e.g., ascites) were excluded. Raw count files for the remaining eligible samples were downloaded, and individual samples were split and processed into AnnData (h5ad) format for downstream analysis. The detailed metadata were retrieved from the original studies.
Data procession
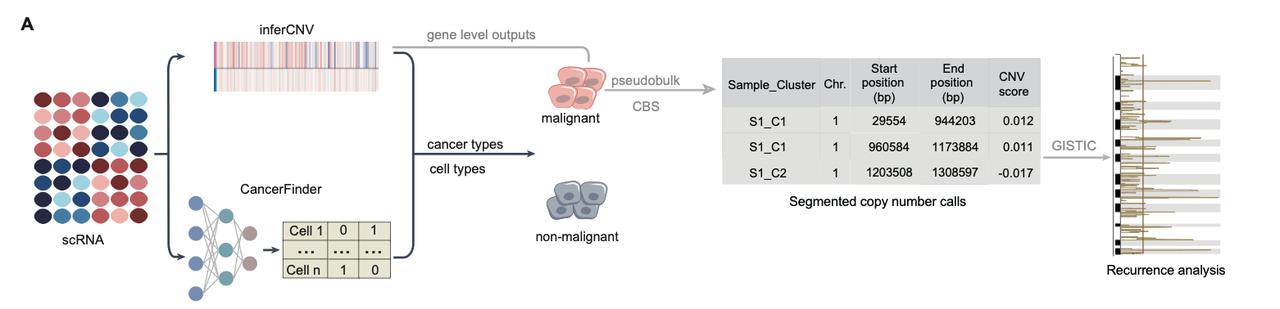
GISTIC
To identify recurrent somatic copy number alterations (SCNAs), GISTIC39 analysis was performed separately for each cancer type. Malignant cells were first selected as described above. Within each sample, malignant cells were aggregated into pseudobulk profiles according to their inferCNV cluster assignments. Gene-level CNV values from inferCNVpy were then used to define CNV segments based on CNV scores. These segment-level pseudobulk CNV profiles were used as input for GISTIC, and reference gene annotations were provided using the hg38 refgene matrix. GISTIC was run with the following parameters: -genegistic 1 (gene-level analysis), -ta 0.01, -td 0.01, -js 5, -broad 1 (include arm-level events), -conf 0.9 (confidence level), and -savegene 1 (save gene-level results), enabling detection of both arm-level and focal CNV events. Arm-level frequencies were compared across cohorts using the broad_significance_results.txt output. For focal amplifications, q-values and G-score from the scores.gistic output were used.
Ecotypes
To characterize ecotypes across primary and metastatic samples, we first calculated the fractions of all annotated cell types within each sample. Then yielding a relative cellular abundance matrix that accounts for differences in overall cell-type composition. Hierarchical clustering was subsequently performed on the scaled matrix using Euclidean distance and Ward’s linkage method he dendrogram was cut into four clusters (k = 4) using the fcluster function from the scipy package, and cluster assignments were visualized using a heatmap with column color bars indicating ecotype membership. This approach allowed the identification of ecotypes defined by coherent patterns of co-occurring cell populations across the tumor microenvironment.